About This Site
This website provides latest data and a few days ahead forecast of relativistic electron fluence at GEO.
Introduction
High-energy particles and electromagnetic waves are referred to as “radiation”. Radiation can be generated by various human-made sources such as nuclear power plants and hospital X-rays, and it also exists in natural environments in the form of radioactive substances such as radon (Rn), uranium (U), and radium (Ra). Radiation that comes from outside the Earth is called “space radiation” and includes high-energy particles originating from far-off universes and from explosive solar activities such as solar flares and coronal mass ejections. High-energy particles trapped in the geomagnetic field are another form of space radiation.
Space radiation cannot easily reach the surface of the Earth due to the Earth’s geomagnetic field and the atmosphere. Thanks to them, it is not necessary to take measures to avoid space radiation in our daily life. However, for astronauts working at altitudes of about 400 km, radiation exposure can be a fatal health hazard. Even for spacecraft flying around the Earth, space radiation can cause damage and spacecraft failure. On this site, we focus on high-energy electrons trapped in the geomagnetic field, called the “electron radiation belt”, and predict flux variation of the electron radiation belt at the geostationary orbit in which many spacecraft are operating.
Criteria of alert level
One of the causes of malfunction and failure of satellites is the phenomenon called electrostatic discharge (ESD). High energy electrons in the radiation belts may penetrate from the outer wall of the satellite body and cause deep charge inside the satellite. If charging progresses, If charging progresses, both soft and hard devices may be damaged by discharge due to dielectric breakdown.
NASA's technical handbook describes that there is almost no problem due to internal charging if the flux of electrons incident inside the satellite is less than 0.1 pA/cm2 (daily fluence 3.8 x 10⁹ /cm2 sr) based on the results of the internal Discharge Monitor (IDM) experiment of the CRRES satellite [Frederickson et al., 1992]. On the other hand, according to the analysis of the phantom command observed at the DRA δ mission, the threshold for anomaly occurrence due to internal charging is 5 x 10⁷ /cm2 sr at the 1-day fluence of electrons with energy ≧ 2 MeV [Wrenn and Smith, 1996]. In geosynchronous orbits, the electron flux with energy above 3 MeV is almost less than 0.1 pA/cm2, and electrons below 3 MeV can be prevented by invasion with 110 mil aluminum equivalents. However, if the shielding design is not sufficient, it is necessary to be wary of occurrence of failures.
Low (fluence : less than 3.8 x 10⁷[/cm2 sr])
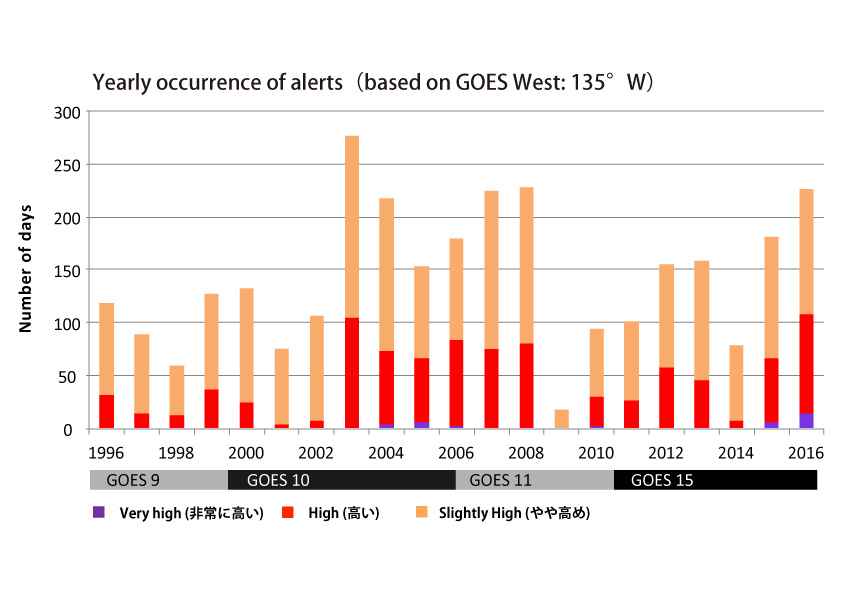
This is relatively a low level condition. Occurrence frequency of this condition is about 60%, based on the statistical results during 1996 and 2016 (as shown in a following panel).
Slightly high (fluence between : 3.8 x 10⁷[/cm2 sr] and 3.8 x 10⁸/cm2 sr])
This is a moderate conditio. Occurrence frequency of this condition is about 20%.
High (fluence : between 3.8 x 10⁸[/cm2 sr] and 3.8 x 10⁹/cm2 sr])
The fluence level reach at this level when strong CME and CIR hit the magnetosphere. Occurrence frequency of this condition is about 10%.
Very high (fluence : larger than 3.8 x 10⁹[/cm2 sr])
The fluence level reach at this level when strong CME and CIR hit the magnetosphere. This is relatively rare event whose probability is less than one percent.
Spacecraft anomalies may occur during conditions of high and/or very high levels. When the high energy electrons suddenly increased on Jan. 20 1994, a communications satellite in Japan (BS-3a) experienced a problem and stopped broadcasting. At almost same time, Anik E-1 and E-2, two communications satellites in Canada also experienced a problem.
Jump to the top of this page ▲
Forecast model
Forecast model for electron variation
Spacecraft anomalies may occur during conditions of high and/or very high levels. When the high energy electrons suddenly increased on Jan. 20 1994, a communications satellite in Japan (BS-3a) experienced a problem and stopped broadcasting. At almost same time, Anik E-1 and E-2, two communications satellites in Canada also experienced a problem.
The forecasts are derived using a multivariate autoregressive (AR) model with a Kalman filter. The AR model uses >2MeV electron flux as a "predictor variate" and solar wind parameters and geomagnetic indices as "explanatory variates". The latest time-series data of these are used as inputs. Details about the prediction models are described in the papers [Sakaguchi et al., Space Weather, 2013,2015].
![]()
An equation used in the AR model. A time series of vector y(t) consists of the predictor and explanatory variates. A(t), v(t), and index m are a regression coefficient matrix, a time series of white noise vector, and a regression index, respectively.
High-energy electron flux in three-dimensional spatial coordinate
We use models of a geomagnetic field (Tsyganenko model), particle trajectories in the magnetic field (GEMSIS-RB model), and high-energy electron flux (AE8MAX model) to calculate three-dimensional electron flux distribution.
Tsyganenko model (TS05)
This is an empirical model that estimates the geomagnetic field using solar wind parameters and a Dst index.
Tsyganenko model (external website)
GEMSIS-RB model
This is a relativistic test particle code in three-dimensional electromagnetic fields that solves the guiding center equations. This model was developed as part of the GEMSIS projects at Nagoya University.
GEMSIS-RB model (external website)
AE8MAX model
This is an empirical model that estimates electron flux in the L direction (similar to the radial direction) in the geomagnetic field during solar maximum phase.
AE8 model (external website)
Using real-time solar wind data and the Dst index, the Tsyganenko model estimates a three-dimensional magnetic field structure. In the estimated field, the GEMSIS-RB model calculates three-dimensional trajectories of many electrons (> 104 in the calculation system). The AE8MAX model is used to determine the “weight” of each electron by estimating the flux level in the L direction with a simple pitch angle distribution model. The flux of each electron is integrated at each grid point of the three-dimensional space.
We are currently using the AE8MAX model to estimate the three-dimensional flux distribution. In our future work, we intend to improve our forecast model by applying the predicted flux distribution, which should lead to more accurate forecasting of the electron radiation belt flux in three-dimensional space.
Jump to the top of this page ▲
Observation data
We use several kinds of observational data to forecast the high-energy electron flux in a geostationary orbit. We acknowledge all the facilities and staff that provide the observational data. Data accessed on this site must be treated in accordance with the specifications indicated by the data providers.
■GOES satellite
The Geostationary Operational Environment Satellite (GOES) series satellites, which were first launched by the U.S. in 1975, circle the Earth in a geosynchronous orbit to measure the environment. GOES are equipped with a space environment monitor (SEM) that can observe high-energy particles, magnetic fields, X-rays, etc. Our Web site shows real-time data of >0.8 MeV and >2MeV electron flux and >10 MeV and >100 MeV proton flux observed by an Energetic Particle Sensor (EPS) on these satellites.
* Real-time data might be revised after calibration.
Data source site:
http://www.ngdc.noaa.gov/stp/satellite/goes/index.html
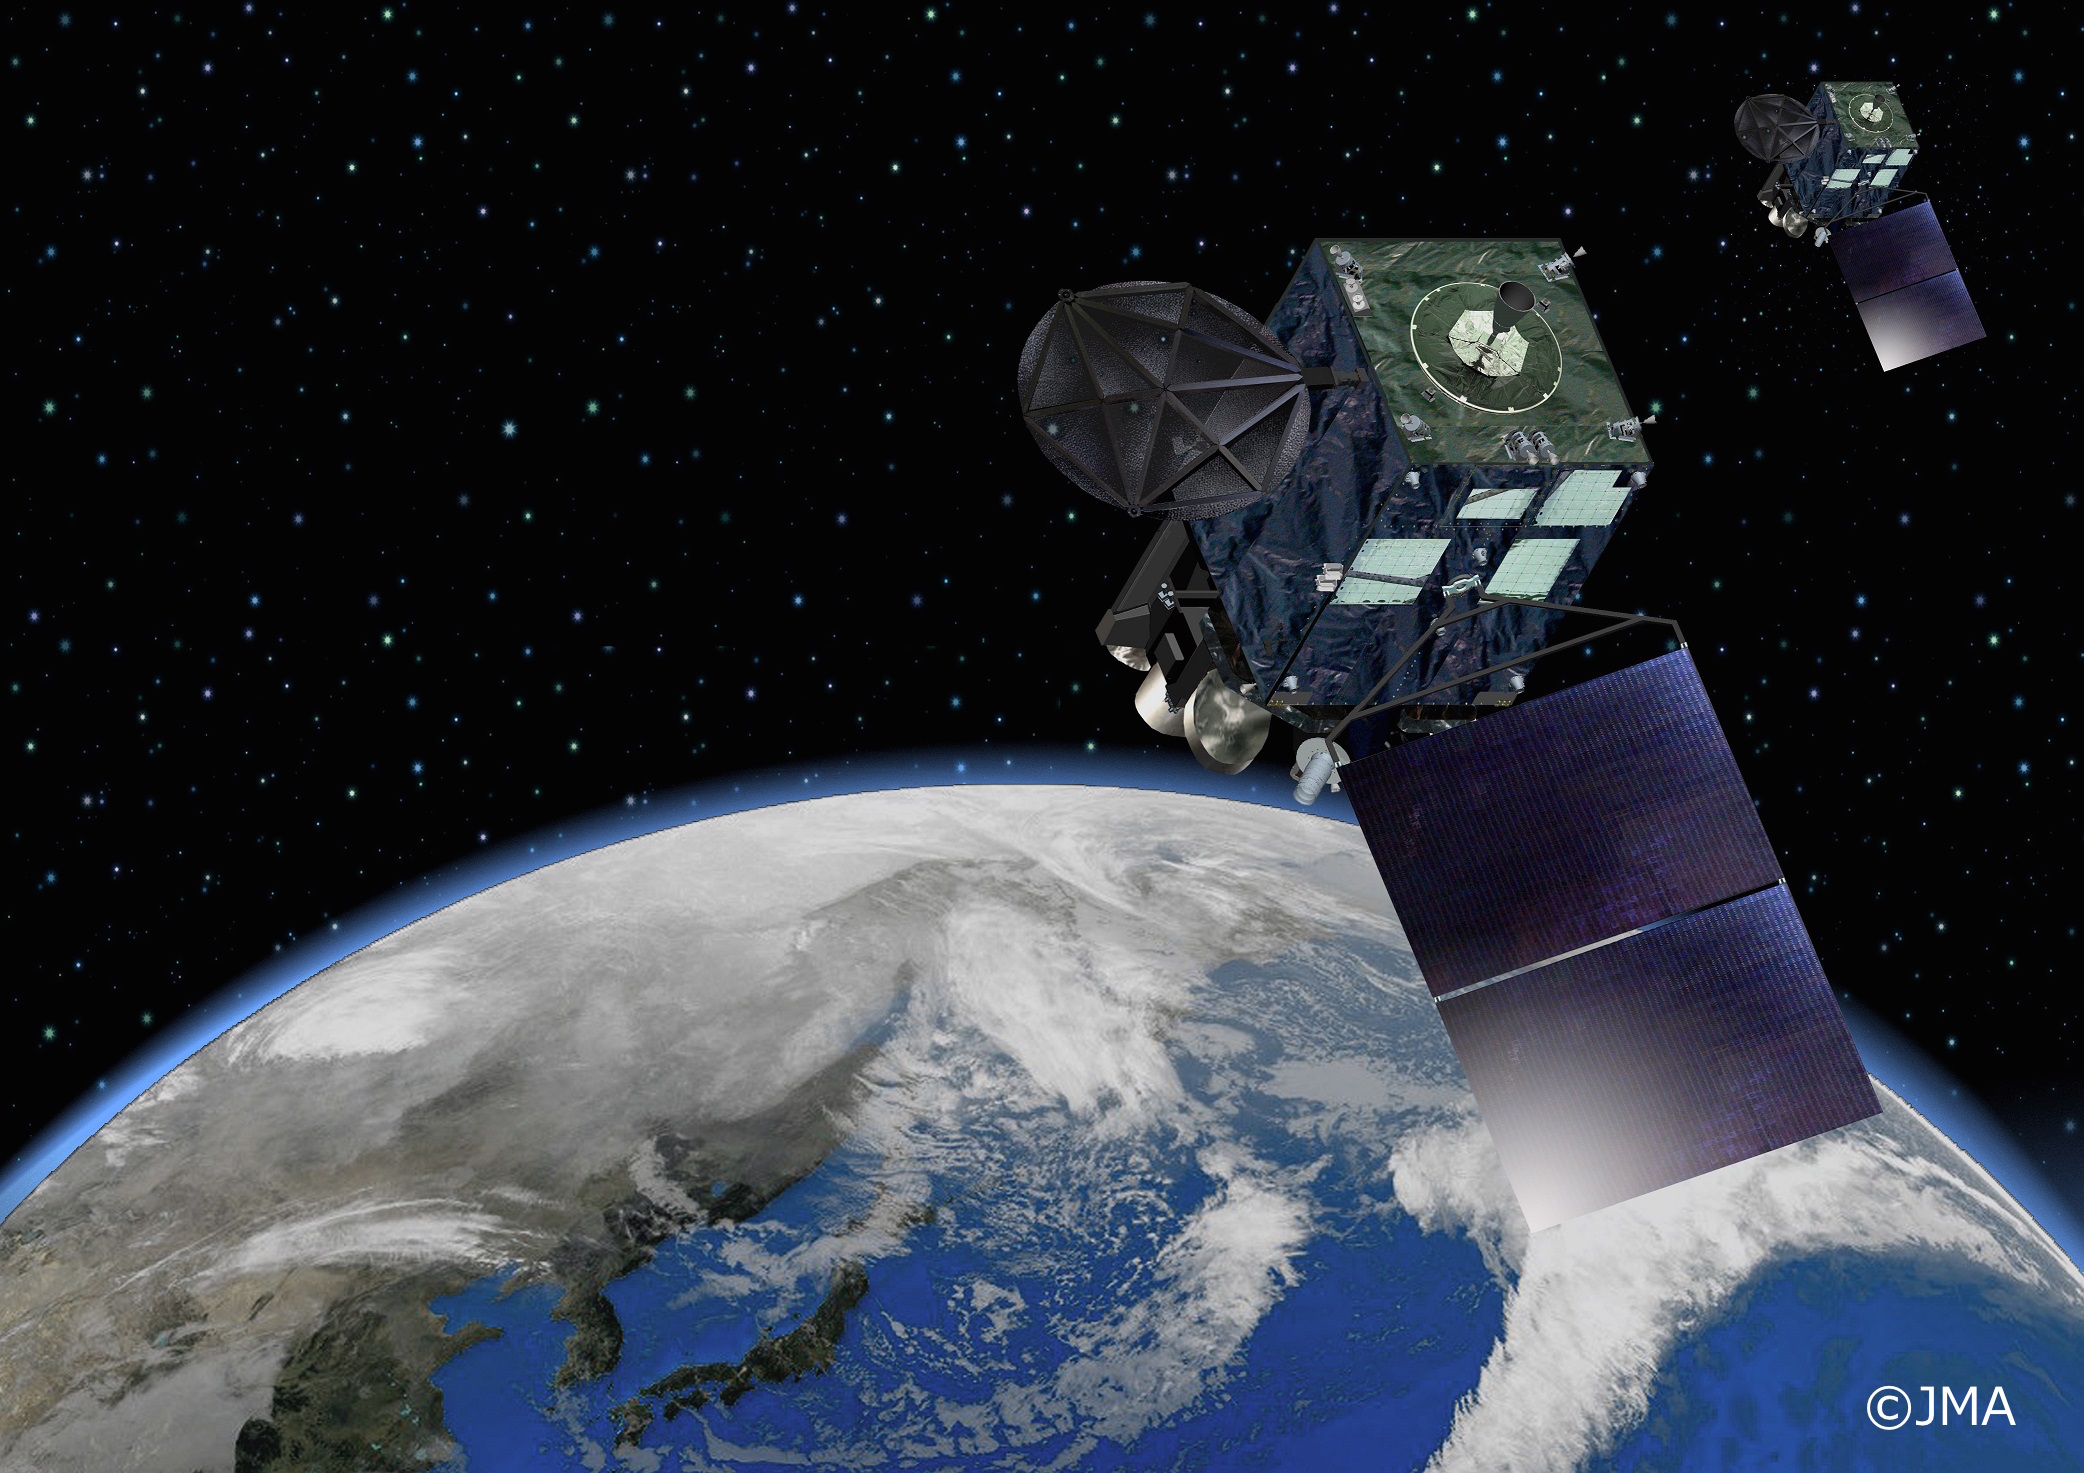
■HIMAWARI satellite
The HIMAWARI-8 was launched in October 2014 from Japan. "HIMAWARI" is a series of geostationary meteorological satellites orbiting 140 degrees East. The HIMAWARI-8 is equipped with a Space Environment Data Acquisition monitor (SEDA) that observes high-energy electron and proton flux. We provide 0.2-2.0 MeV(7 channels)electron flux and 21.6, 29.9, 37.9 MeV proton flux data from "Observation data BOX" page.
Data source site :
http://seg-web.nict.go.jp/himawari-seda/
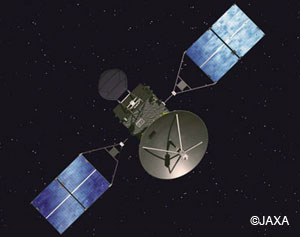
■”KODAMA” DRTS
The KODAMA Data Relay Test Satellite (DRTS) was launched in September 2002 by the H-II A launch vehicle from the Tanegashima Space Center, Japan. The operation has ended on 5 August 2017. This is a data relay test satellite that is a kind of communications satellite functioning in the geostationary orbit. The KODAMA is equipped with a Standard Dose Monitor (SDOM) that observes high-energy electron and proton flux. We provide 0.2-2.0 MeV(7 channels)electron flux and 21.6, 29.9, 37.9 MeV proton flux data from"Observation data BOX" page.
Data source site:
http://seesproxy.tksc.jaxa.jp/fw_e/dfw/SEES/English/Data/data_drts_e.shtml
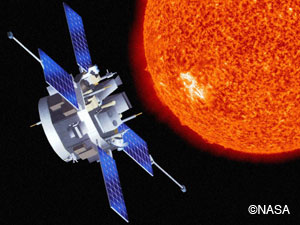
■ACE Spacecraft
The Advanced Composition Explorer (ACE) was launched on a McDonnell-Douglas Delta II 7920 launch vehicle on August 25, 1997. The ACE observes energetic particles arriving from not only the sun but also from interstellar and galactic sources. The ACE is located at the L1 point of the Earth-Sun gravitational equilibrium (1.5 million km from the Earth). The ACE is equipped with several instruments, including a Solar Wind Electron, Proton, and Alpha Monitor (SWEPAM), Magnetometer (MAG), and others. ACE can continuously observe solar wind at a fixed location (L1) and that provides solar wind and energetic particle data in real-time. Our Web site shows real-time data related to solar wind bulk speed, solar wind density, and the interplanetary magnetic field. From the end of July, 2016, DSCOVR is the new operational spacecraft for monitoring real-time solar wind. Thus, there is no continuous coverage of ACE observation now.
* Real-time data might be revised after calibration.
Data source site:
http://www.swpc.noaa.gov/products/ace-real-time-solar-wind
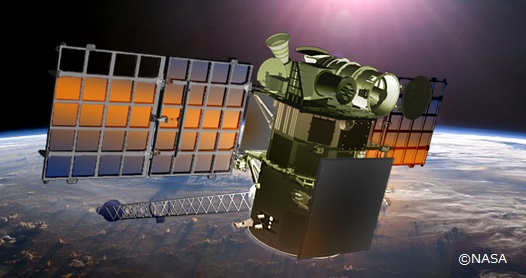
■DSCOVR Spacecraft
The Deep Space Climate ObserVatoRy (DSCOVR) was launched on February, 2015. The DSCOVR is located at the L1 point of the Earh-Sun gravitational equilibrium, the same as ACE spacecraft. The DSCOVR is equipped with single instrument for measuring solar wind particles and interplanetary magnetic field (PlasMag). This spacecraft is in routine operation of solar wind monitoring from the end of July, 2016. Our Web site shows real-time data related to solar wind bulk speed, solar wind density, and the interplanetary magnetic field.
* Real-time data might be revised after calibration.
Data source site:
https://www.ngdc.noaa.gov/dscovr/
■AE index (AU/AL/AE)
The AE index is a geomagnetic index related to ionospheric aurora electrojet activity in auroral zones. The AU/AL indices refer to the upper/lower values derived from the envelope of the superposed plots of data in a given auroral zone. The AE index is defined as AU – AL. This site provides real-time data of the AU, AL, and AE indices.
* Real-time data might be revised after calibration.
Data source site:
http://wdc.kugi.kyoto-u.ac.jp/
Positions of magnetometers used to produce the AE index.
©WDC Kyoto Univ.
■Dst index
The Dst index represents the degree of a geomagnetic storm. It monitors equatorial ring current variations in the inner magnetosphere. The Dst index is derived from data collected at four magnetic observatories in the middle and low latitudes, including the KAKIOKA magnetic observatory of the Japan Meteorological Agency.
* Real-time data might be revised after calibration.
Data source site:
http://wdc.kugi.kyoto-u.ac.jp/
Positions of magnetometers used to produce the Dst index.
©WDC Kyoto Univ.
Contents of this page